A Clear Approach to Color Combinations

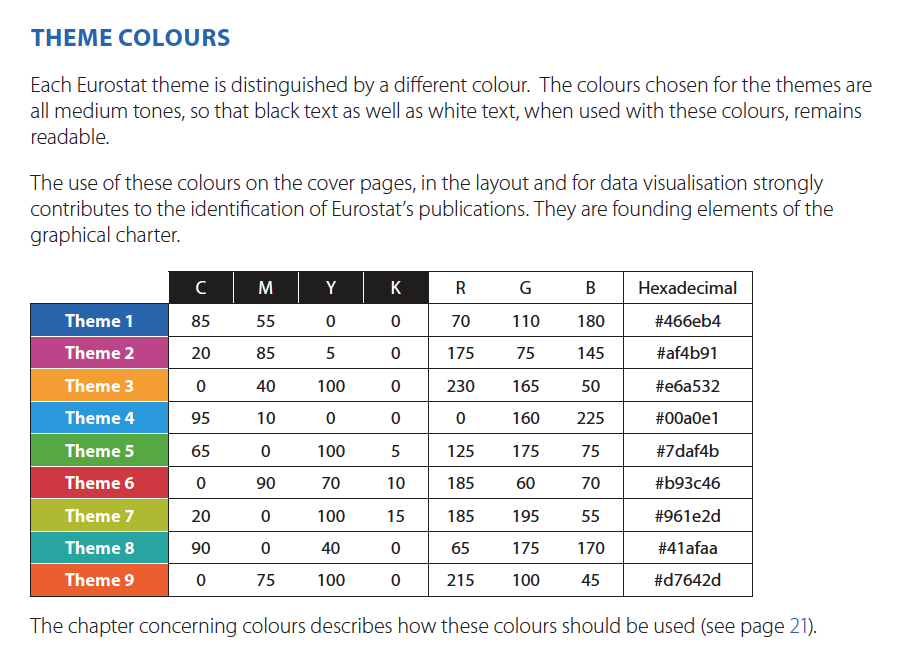
The 2016 Eurostat style guide is not solely focused on data visualization, though they do have a specific chapter on charts and graphs (“The Eurostat figures”). The Eurostat guide is especially good at defining and demonstrating good use of their color palette. Towards the beginning of the guide (page 12), they lay out nine specific color codes (with CMYK, RGB, and HEX codes) in an easy-to-read (and copy) table.
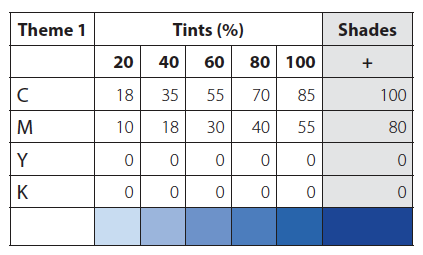
In the data visualization chapter, they define three possible color combination palettes as well as tints and shades for all of the nine colors. I also appreciate an interesting and unique diagram that shows users how to prioritize and implement the different colors–and a quick note about color contrast considerations (though there isn’t a more detailed section on accessibility).


Written by Jon Schwabish